
What is doji candlestick pattern
Doji candlestick pattern is a pattern that appears when there is a confusion between the buyers and the sellers in the market. It is a point of break even of price between the buyer and the seller. The buyers don’t want to buy above this price and the seller don’t want to sell below this price.
If you have observed, the doji candlestick pattern have the same opening and closing price. Hence the body of the candle is very minimal. It has long wicks on both ends, showing that the buyers and the sellers has tried to drag the price in their favor.
A doji candlestick is very easy to identify. Watch the chart of the stock and try to identify the trend. After you have identified the trend try to see points of low price movements. A doji candlestick usually have long wicks and a very narrow body, as depicted in the charts in this blog.
Before explaining the trading strategy, I want to share a thought on the psychology behind the doji candlestick pattern
Why are doji patterns important
Doji patterns act like market halt. If the stock has seen a momentum gain in the recent past, it is evident that the stock will not continue to rise or fall forever. There will be some instances where the stock will resume for a while and then again decide to move.
This halt will form the doji. After the formation of doji, the fundamentals and other factors will decide if the stock will continue the momentum or change the trend.

If you closely observe the above chart of Reliance Industries Ltd. you will notice two instances of doji formation. This is the chart after Reliance gained momentum after the news of Facebook investing in Jio.
In the first instance, the stock rallied significantly and formed a doji (as marked in the figure), but instead of the trend reversal it continued to rally further up because of the positive news backing it. It finally created a high at second doji, where it finally decided to change the trend.
These doji points are very important in technical analysis as they as like trend change points or create a point of support and resistance.
What’s the psychology behind doji
After a strong gain in momentum, the stock moves in a directional trend in a short span of time. At this time the buyers are sitting with profits.
They are in a state of dilemma whether to sell the stock back or continue the trend. Because of this dilemma there is a delay in the buying activity and the stock moves side ways, hence forming a doji.
Strategy for day traders
Scalping with doji
Scalping is a type of trade where you buy and sell stocks for a fraction of a second in large volumes. The idea is that you take advantage of the small price movement in your direction with a large volume to generate you profits.
One needs to have a good experience with the markets to perform scalping. A proper risk reward trade has to be maintained with a right stop loss before executing the trade.
A doji candlestick on a 5 minute time frame can be a indication for a small trend reversal where scalping can be done.
Doji with RSI indicator
RSI (Relative Strength Index) is a indicator that shows if a stock is over brought or over sold for a particular time duration. A great trade can be taken if the RSI is in the oversold zone and a doji pattern is formed in the charts.
I will write a separate blog explaining more about RSI. For now you can know that RSI indicates if the stock has been in the overbought zone or oversold zone.
This trade can give you a entry point for a BTST trade. A formation of doji in the RSI over bought zone can be a indication that the market will reverse the trend, so traders can go short in the stock.
On the other hand, a formation of doji in the oversold zone can be an indication that the stock is going to reverse its trend and one can go long in the stock.
Strategy for long term investors
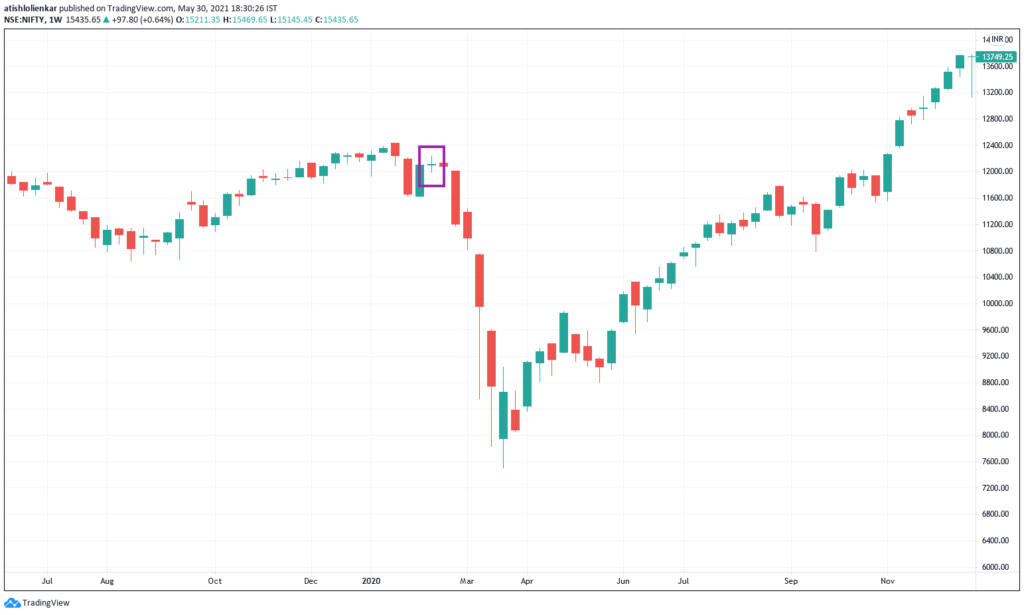
Doji on a weekly time frame
Weekly time frames are most ideal for long term investors as it depicts the stock performance for a longer duration. They are also a good check for investors who want to have an entry or exit points in a stock.
Doji patterns are usually formed to create a trend reversal. Therefore a doji pattern after a bearish movement can be a good indication for stock to reverse its trend.
Note: This is just an indication for trend reversal. Long term investors should also take fundamentals of the stock into consideration before going long in any scripts.
Doji with moving average
Moving average is a very important indicator for many investors and traders. Analyzing a stock on a 200-day moving average is a good focus point for long term investors. When the price of the stock reaches this point it is evident that the stock is trading at a good price.
All you have to do is wait for the stock chart to create a doji candlestick. A doji will confirm a trend reversal and can be a good entry point to go long.
Doji with 52 week high
Usually 52 week high are a great trigger for sellers. The stock is trading at a fresh all time high and the investors want to book their profits in this zone.
If you observe a stock rally and created a 52 week high and formed a doji pattern on a daily or a weekly time frame, then there are high chances that the stock can get some correction.
If the long term investor wants to exit a particular stock then this is a ideal scenario.
Conclusion
There is no strategy or a system that will work 100% of the time. These are just indications the increase the probability of odds being in your favor.
Personally I prefer doji for long term investments for entry and exit points of stocks with great fundamentals.
