Chapter 3: A Century of Stock Market History
In chapter 3 of the intelligent investor, the author displays the 100 year stock market movement. Thus, this behaviour of the stock market for over a century helps the investor to understand how the prices of a stock behave over a long duration.
In addition, referring chapter 3 of intelligent investor, a reader will get a clear understanding on how the stock market cycles work as a whole.
These historical data can help an investor to gauge the next hundred years of the stock market performance.
Understanding past stock prices, earnings, and the volatility that one must be willing to take into account while formulating an investment strategy is covered in Chapter 3 of Intelligent Investor.
The investor’s portfolio of common stocks will represent a small cross section of that immense and formidable institute known as the stock market.
In brief, the author tries to showcase the major fluctuations in the price levels and and varying relationship between stock price as a whole and their earnings and dividends.
The statistics of the historical data does help us in providing an edge in better decision making for stock market investments, mitigating risk and understanding the markets in general.
The author wants to show the charts index movements with 2 objectives in mind:
- To show the general manner in which the stocks have made their underlying advances through the many cycles.
- To view the picture of the successive 10 year average, not only of the stock prices but also their earnings and dividends, to bring a varying relationship between them.
Also Read: Chapter 8 Of The Intelligent Investor Explained For Beginners
The Long Term History of Stock Market
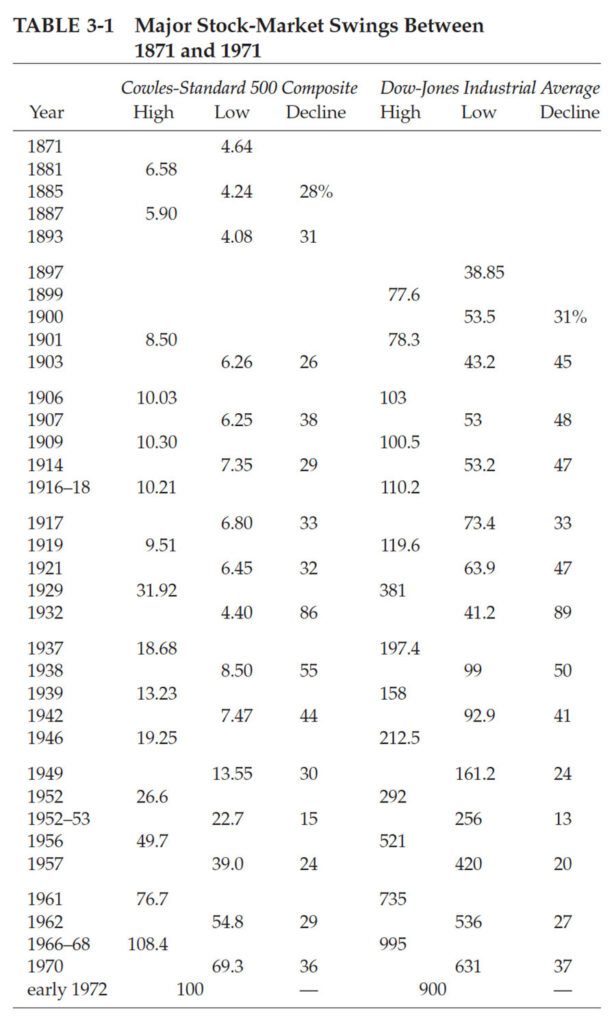
The author states that the best way of understanding the historical behaviour of stock market is by studying the two charts:
- Low and high of 100 year stock market history
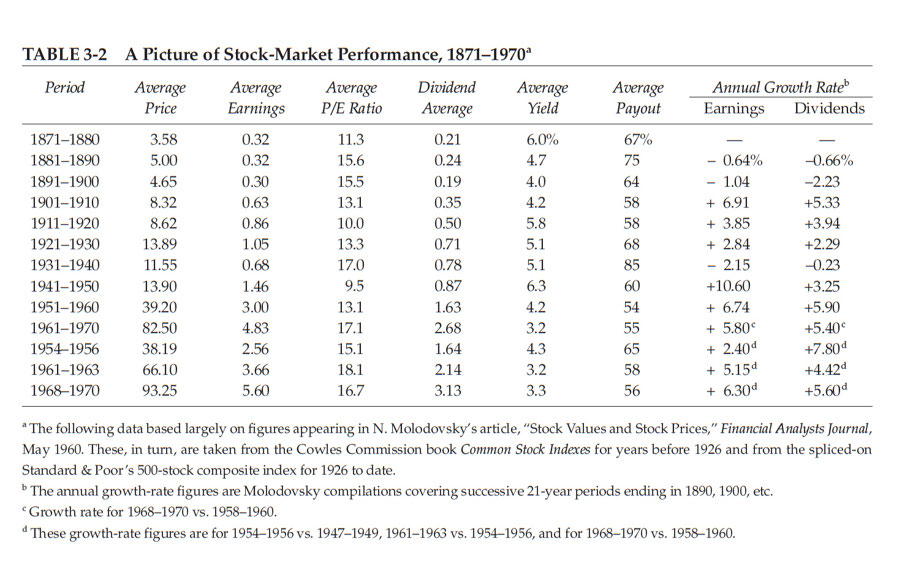
- Performance of stock market vs earnings and dividends
Low and High of 100 Year Stock Market History

The numbers and the factual data have been explained using bullet points and summary tables in this blog for the ease of understanding of the readers.
There were 19 bear market and bull market cycles over the period of 100 years.
The author brings forward the DJIA (Dow Jones Industrial Average) index for the period from 1897 to 1971. Therefore, the author uses historical data in terms of numbers to make the readers understand how the stock market actually works.
| Period | Stock Market Observation |
|---|---|
| 1900 – 1924 | During this period, the average returns from the stock market was just 3%. It was a beginning of a bull run. |
| 1929 – 1949 | The expected bull run turned out to be a market collapse with average return of 1.5%. |
| 1949 – 1968 | Rapid recovery with average returns escalating up to 11%. |
| 1969 – 1970 | Subsequent decline in the markets with an average return of 9%. |
Note:
- The gains from the dividend is not factored. An additional 3% dividend was gained during the bull run.
- In the year 1964, market documented returns of about 14%.
Know Why Warren Buffett Love Chapter 8 And 20 Of The Intelligent Investor
Performance of Stock Market vs Earnings and Dividends
Do you think the price movement of the stock replicate the earnings and dividend of the company?
In order to showcase the relationship between the price movement of the stock and its earnings, the author showcased us the Table 3.2 in his book “The Intelligent Investor”.

The author shows the study of 10 decades of stock market performance as shown in the table.
Also, the author highlights that, only for 2 decades there were decrease in earnings and in no decade after 1900 had shown decrease in dividends.
| Period | P/E Ratio of S&P 500 Index |
|---|---|
| 1949 | 6.3 |
| 1961 | 22.9 |
Despite the earning being positive for most of the decades, the Price to Earning (P/E) Ratio and the Stock Price kept fluctuating.
From the above case study, it is evident that, the price of the stock does not directly resonate with the performance and earning of the company, but are driven by psychology of investors.
The idea of stock market cycles was then introduced by Graham, who points out that the market frequently experiences alternating episodes of optimism and pessimism.
Conclusion
In conclusion to the book, Graham’s central claim is that the intelligent investor must never predict the future solely by extrapolating the past.
The author believes that the S&P 500 and DJIA are overly risky and that investors should protect their money by including safer alternatives to stocks in at least half of their portfolios.
He claims that overvaluation of equities is a result of speculative excesses and irrational investor behaviour during periods of extreme optimism.
On the other hand, times of pessimism lead to undervaluation, which presents opportunity for wise investors to identify deals.
You might also like: Chapter 20 Of The Intelligent Investor Explained For Beginners

