
Introduction
As a technical analyst, it is crucial to be aware of all the important technical patterns in order to execute and predict the trend of the market and similarly place the trades. One such commonly referred price pattern is the bullish engulfing pattern.
You might also like: How To Trade Using Relative Strength Index Indicator
What is bullish engulfing pattern
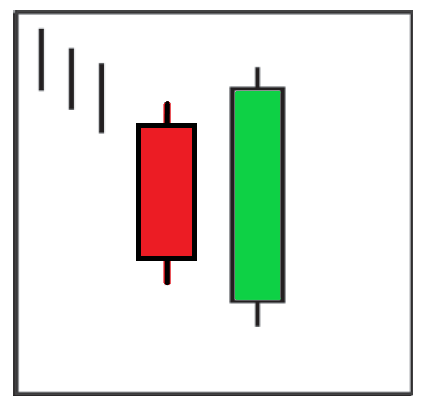
A bullish engulfing pattern is a two candlestick pattern, where a formation of these candles is in such a way, that the green candle formed over shadows the previously formed red candlestick.
As the name suggests, it depicts the bullish nature of a stock. A confirmation of a bullish engulfing pattern will indicate that the price of the stock is in uptrend movement.
Traders usually prefer taking long position in this scenario.
This pattern formation signifies that the buyers are overpowering the sellers in the market.
When four or more red candlesticks precede a bullish engulfing pattern, it is more likely to predict a reversal.
Understanding with an example
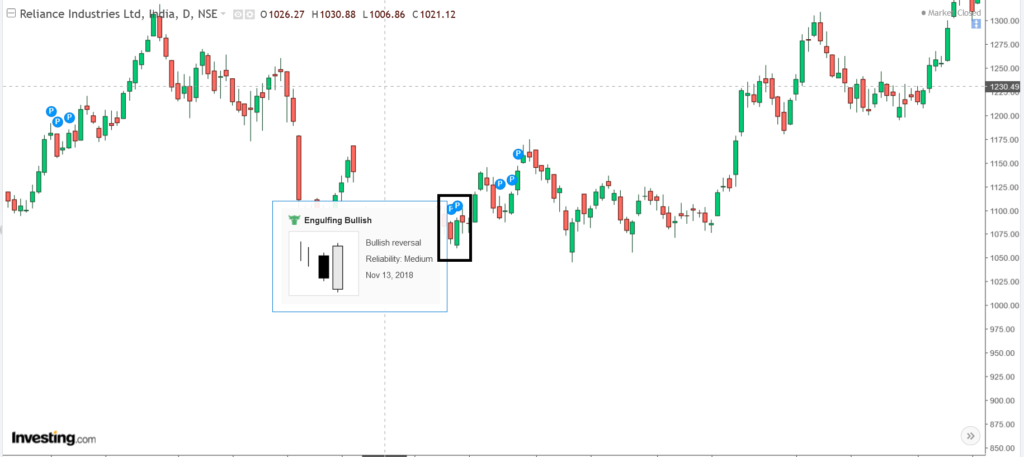
The above chart depicts the formation of the bullish engulfing pattern on the Reliance Industries stock.
In the marked box it clearly shows that the preceding green candlestick has completely empowered the previous red pattern.
After the formation of this pattern, the price of the stock rallied up, showing a positive price movement.
Here are 5 ways to identify bullish engulfing candlestick pattern
This is a two candlestick pattern. Thus, in order for a trader to identify these type, one needs to narrow down his observation on looking for only two adjacent candlesticks.
For a formation of a bullish engulfing pattern, the following 3 things are needed to be identified:
- The previous candle closing lower than its open
- The preceding candle breaking previous low
- The preceding candle breaking previous high
- Price supported by increase in volumes
- Checking the previous trend for confirmation
The same can be better understood by the following picture

Let us understand these points in detail
The previous candle closing lower than its open
When the previous day’s candle closes at a lower price than its open, it leads to the formation of a red candlestick pattern.
This signifies that the sellers have dominated the market. This can also be due to the continuous down trend price movements, and the same has been reflected in the price momentum of the stock.
The preceding candle breaking previous low
At the very next day, the preceding candlestick open with a low and breaks the previous days low. This is when the bulls enter the market and dominate the trend.
When the low has been broken, it shows the last ability of the market to push thee prices down. In this scenario, the momentum has collapsed and the bears are dead.
The preceding candle breaking previous high
When the bulls dominate the markets, the preceding candlestick creates a new high and finally closes above the previous day high.
Thus, leading to the formation of a pattern as depicted in the above figure.
Since the stock was following a downtrend for a couple of preceding days, it provides a good opportunity for long term investors to invest in the stock at these low price points.
Price supported by increase in volumes
The trader also needs to check for the correspond increase in volumes after the formation of the green candlestick to confirm the bull trend.
Large volumes on the engulfing day indicate a bullish break out day as occurred.
Checking the previous trend for confirmation
A bullish engulfing pattern is characterized by a green candlestick that ends higher than the previous day’s opening after beginning lower.
When a red candlestick indicating a bearish trend is followed the next day by a huge white candlestick indicating a bullish trend.
What does this pattern indicate
Bullish Engulfing patterns, when employed properly and in the right places, may result in very successful trades and consistent returns.
These patterns helps an investor to increase their chances of making a profitable trade. Candlestick signals transmit common sense aspects, making them a straightforward trading approach for both novice and expert traders.
Conclusion
A bullish engulfing pattern can be a strong indicator, especially when paired with the current trend, but it is not foolproof strategy.
Engulfing pattern are especially effective after a definite downward price move since they clearly highlight the upward momentum change.
The significance of the engulfing pattern is decreased if the price movement is choppy, even if the price is increasing overall, because it is a fairly typical indicator.
Also Read: The Best Doji Candlestick Trading Strategy For Beginners
