
What is Relative Strength Index (RSI)
Relative strength index is a momentum gauging indicator that tells the investor or a trader if the selected stock is overbought or oversold.
How does it actually tell you that? And how accurate are the indications?
In this blog post we shall answer these questions. Also I will be sharing the right way to use the indicator and share some strategies for traders and long term investors.
RSI is a line graph which moves between 0 to 100 and is placed parallel to the chart of the stock which shows its price movement vis-a-vis.

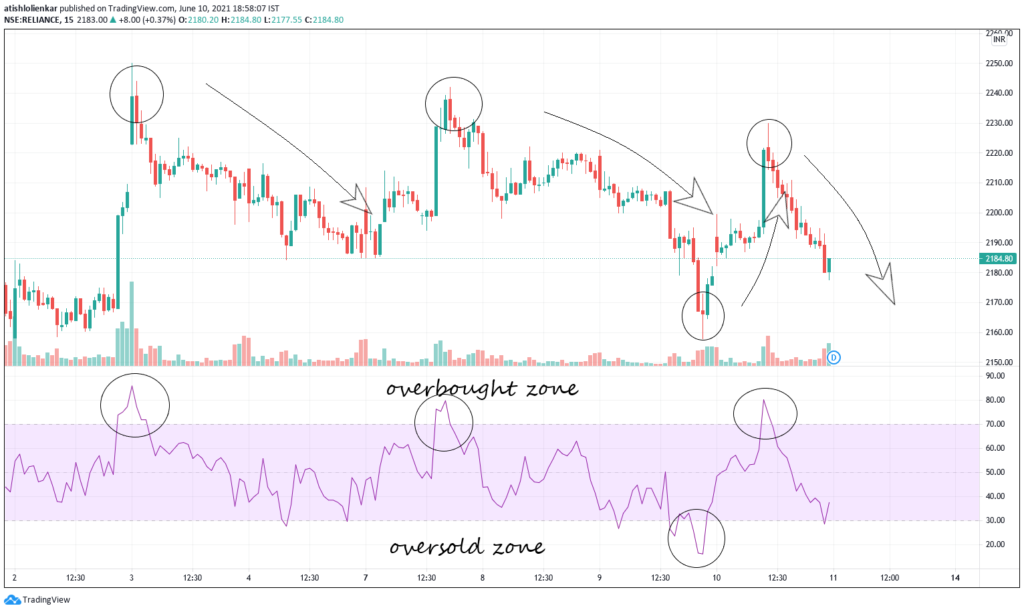
The stock is considered overbought if the RSI is above 70, and oversold if the RSI is below 30.
The following are uses of RSI
- To Analyze if the stock is overbought or oversold
- For identifying the trend of the stock
- To check the momentum of the price movement
RSI tells the bullish or bearish behavior of the stock based on its line movement. If the RSI line moves from top to down, we can indicate that the stock can undergo bearish behavior. On the other hand, if the RSI line is moving from down to top, we can safely assume that the stock is bullish.
A change in the direction of RSI is predicted to have a directly proportional change in trend of a stock price.
Mathematically, RSI can be represented as:
RSI = 100 – 100/(1+RS)
Where RS = Average gain/Average loss
When you select RSI length 14 as depicted in the image above, in that case:
Average gain = Sum of the gains for the last 14 candle bars / 14
Average loss = Sum of the losses for the last 14 candle bars / 14
If you select the RSI to analyze the stock on a daily chart, in that case the sum of gains or losses will be for the last 14 days respectively.
The most common length used for RSI by many investors in 14 day RSI. One can also select between 9 days RSI and 21 day RSI for the same.
What problems does RSI solve
RSI is one of the most popular trading indicator used my many investors and traders.
It is a technical indication of the stock to be over valued or under valued. One should not try to compare it with fundamental analysis like EPS (Earning per share) or PE (Price to earning) ratios. Long term investors should first analyze the fundamentals of the stock and then use RSI to either short the stock or go long in it.
One of the challenging scenarios for the investors can be questions like “What stock to invest in”. The next question any investor will have is “When to invest”
RSI can be the answer to the “When to invest”.
Trading strategy by using RSI indicator
The trading strategies are divided into two main parts:
- Trading strategy for short term investors: These strategies can be used by short term investor, swing traders to gauge the short term price movement of the stock.
- Trading strategy for long term investors: These strategies are more practical for investors who want to go long in stock for purpose of long term wealth creation. Analyzing a good time to enter a stock stock with good fundamentals.
RSI for short term investors and traders
Short term investors can go for a swing trade you an simply go short if the RSI is in the over brought zone or go long when the RSI is in over sold zone.
The psychology behind this trading strategy is that when the stock gains sudden momentum, it tends to re trace a bit or give a sudden bounce back.
The traders need to take advantage of this slight movement.
RSI for long term investors
RSI with moving average
Moving average indicator is yet another most popular momentum gauging indicator. A moving average can tell an investor about the overall trend in the market. A change in the direction on moving average can also confirm a change in trend direction.
Thus, if the RSI of a stock is at low and the moving average has shown a change in trend by continuously moving in downtrend, this can be a good time to buy a particular stock.
RSI with fundamental analysis
A stock with good fundamentals are bound to give good returns over time.
But the question is when?
You know that a particular stock has a good balance sheet record, but you are too scared to go long as you can’t gauge the when the stock will pick momentum.
One of the ways to identify this is my studying the RSI.
RSI at 30 will tell you to go long in a particular stock with good fundamentals, so that you can gain those returns right after you buy.
RSI with doji candlestick pattern
A doji candlestick is a popular candlestick pattern that tells the investor / trader when the trend reversal will take place. A doji with a continuous downtrend will give a signal that people are in no position to sell beyond this price.
This is a good time for long term investors to hold the shares. For further clarification, the investor can also see the RSI of that stock. If it is at its low and it started moving up along with a doji from continuous downtrend, this can assure the stock will rise in the near future.
If the stock may still not pick the expected momentum, you can be confident that you can picked the stock at a discount or a much lower than its intrinsic value. All you need to do is stay invested for a sizable duration.
You may also like: The Best Doji Candlestick Trading Strategy For Beginners
Conclusion
I hope you have understood the importance of RSI. Try using this trading indicator and share your experience with me. If you want me to cover any other topic in the field of finance or real estate, do ping me on my social media.
Also read this research paper for your reference on more depth on this topic: Download research paper
