
Introduction
Technical analysis is all about studying the patterns formed by different candlesticks on a stock chart. One of the prominent type of price pattern traders look for is the doji candlestick pattern.
It is a price sensitive pattern that can help to predict the price movement of a stock. Thus, till today, this pattern is still popular among price action traders.
What is Doji Candlestick Pattern
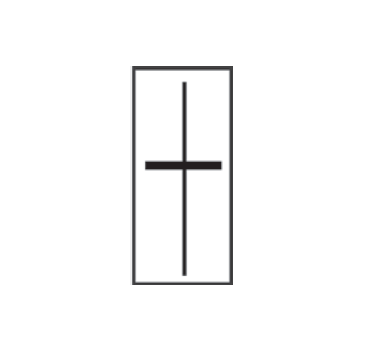
A doji is a term for a price chart in which the open and close of a stock candlestick are almost equal. Doji candlesticks have the shape of a cross, an inverted cross, or a plus sign.
There is a formation of a doji pattern when buyers and sellers in the market are confused in their positions. It is the moment at which the buyers and sellers volume are equal.
Buyers will not purchase over this price, and sellers will not sell below this amount.
This price level is of utmost critical for a technical analyst, because among the market participants who dominate will ultimately drive the market in their favour.
A perfect doji candlestick has a same opening and closing price. But even if the opening and closing price are in close proximity to each other, it can also be regarded as a doji.
When the closing price is slightly higher than the opening price, it is regarded as a green doji. On the other hand, if the closing price is slightly lower than the open price, it leads to the formation of a red doji.
Thus, learning to read the doji pattern is extremely beneficial for short term investors / traders in order to execute the trades.
Properties of a Doji Candlestick Pattern
The following are some of the properties of the doji candlestick pattern:
- A doji has a same opening and closing price.
- A formation of doji at the top of the chart is a sign that a downtrend is about to start and vice versa.
- A doji represents indecision in the market.
- It is a point of trend reversal and considered as a pivot point.
A doji pattern is also formed when there are equal number of buyers and sellers in the market. This shows that there is a competition between the bulls and the bears to push the market in their favour.
How to read a doji candlestick pattern
Any candlestick in a technical chart has 2 parts:
- Pattern formation based on the wick of the candle
- Pattern formation based on the body of the candle
Let us understand these points with elaborate details.
Pattern formation based on the wick of the candle
A wick is a line dragged on a candle in a chart to show where a stock’s price has varied in relation to its opening and closing values.
It is also known as the candle’s shadow. These shadows represent the greatest and lowest prices at which a security has traded during a certain time period.
Depending on the formation of the type of wick, the doji candlestick can be classified as:
- Common doji
- Long legged doji
- Gravestone doji
- Dragonfly doji
Let us understand the formation of these doji candlesticks in detail.
Common doji
A common doji candlestick pattern that is neutral in nature. This pattern occurs when buying and selling are almost identical.

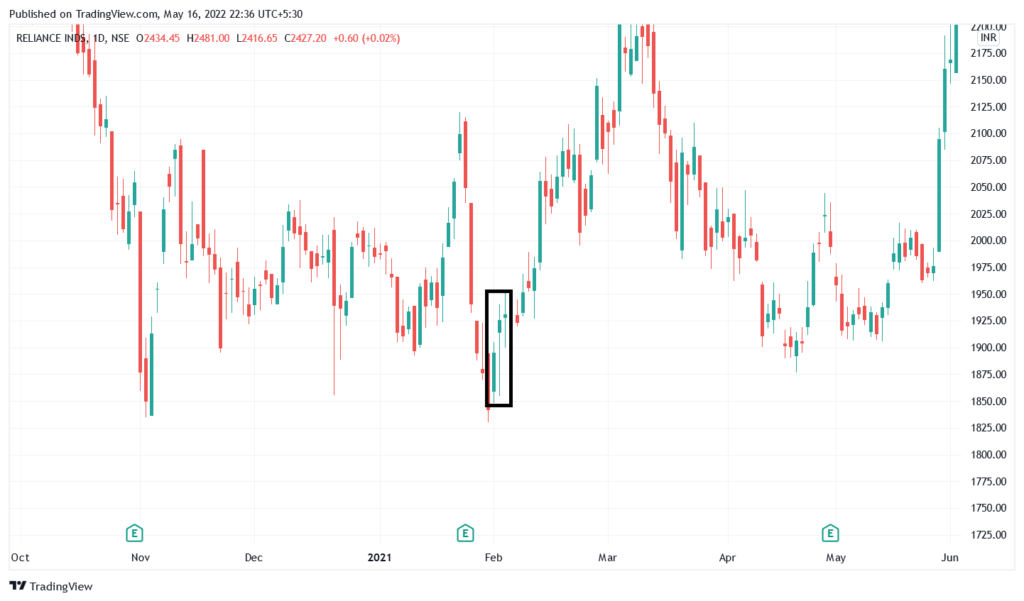
The above picture shows a formation of a common doji candlestick pattern. If observed closely, it is a point of pivot where the stock changes its trend.
As a trader, one can short the stock at these levels to make profits.

In the picture shown above, there is a formation of a doji candlestick. In this case the pattern pivots a position from a downtrend and makes the stock move higher.
Long legged doji
Long legged doji is formed when there is an extreme amount of volatility in the market. The buyers try to pull the market as high as they can and the sellers try to short in large volumes.
A long legged doji will have a huge gap between the days high and says low, and at the same time have the open and close prices at close proximity.
A long legged doji implies that there is tough fight to move the prices between the bulls and the bears. There is shear aggression between the buyers demand and the sellers supply.
These types of trends usually take place on event based trading days where the market participants are confused between holding and exiting.
Gravestone doji
A gravestone doji is where the upper wick of the doji is longer than its lower wick. This implies that, initially the buyers were in full control the push the markets higher. But eventually they had to settle with the equivalent amount of shorts at the end of the trade.

Dragonfly doji
A dragon fly doji is a type where at first the sellers were dominating the first half of the market. But then buyers step in try to dominate the sellers.
Thus, in a case of a dragonfly doji, the lower wick of the candle will be way longer than the upper wick. But ultimately closing will occur at the similar levels between the open and close.

Pattern formation based on the body of the candle
On the basis of the formation of body, the doji can be classified as:
- Green doji
- Red doji
- The perfect doji
Let us understand these classifications in detail.
Green doji
When the closing price of a stock is higher then the opening price, there is a formation of a green doji pattern. In this case, the bulls managed to slightly dominate the markets. This signifies that the bulls still hold some amount of convictions in holding their trades.
When there is a formation of a green doji it can also send an indication that the market can pivot from this point if the they were continuously in the downtrend in the past trading periods.
When there is a formation of a green doji in the uptrend of the price movement, it can indicate that thee stock may break out.
Red doji
A red doji gets formed when the closing price is lower than the opening price of a stock. This indicates that, between the battle of bulls and bears, the bears slightly dominate the market.
The perfect doji
A perfect doji is a candlestick with neither a green nor a red colour over it.
This is an ideal case. It is practically not possible for the market to open and close at the exact same levels. Thus, at any point, there will be a small gap between the open and close prices of the stock.
Psychology behind the formation of doji pattern
A formation of doji candlestick represents the lack of decision making ability between the buyers and the sellers.
If the markets have rallied up and is in the over brought zone, a formation of doji can mean that there is a lack of confidence for the buyers to stay convicted to hold at the desired levels.
On the other hand, when the markets have rallied in a downtrend, a formation of doji can mean that the the sellers a self doubting their positions on the low levels.
A doji is regarded as a trend reversal candlestick pattern.
Conclusion
A doji candlestick is a non-directional indicator that offers little insight.
As a doji does not occur frequently, it is not a dependable technique for detecting price reversals. When it does happen, it may not always accurate. Following the confirmation candle, there is no guarantee that the price will continue in the predicted direction.
The doji candlestick patter should be used only as a reference and not a holy grail strategy for trading.
Also Read: The Best Doji Candlestick Trading Strategy For Beginners
