
What is a Doji Candlestick Pattern
Doji Candlestick is a type of pattern that has the same opening and closing prices, yet having some flexibility during the period of formation.
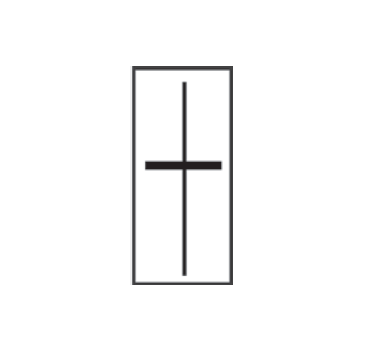
The opening and closing prices are roughly equal or very close to one another. This gives the Doji Candlestick Pattern its distinctive shape of a skinny, nearly nonexistent body.
The long wick of the candlestick showcases the range between the highest and lowest price levels achieved over the specified time period, yet maintained to close at its opening price.
The Doji’s capacity to represent an equilibrium and level of uncertainty in the market is what makes it so appealing. It depicts a conflict between buyers and sellers, denoting a brief standstill in which neither bulls nor bears can prevail.
This uncertainty frequently arises at crucial turning points, such as trend reversals or important levels of support and resistance.
Also read my article on How To Read Different Types Of Doji Candlestick Pattern to understand the properties of Doji.
Here are 4 Lesser Known Secrets of the Doji Candlestick Pattern
Doji Candlestick at the Top
A Doji star at the top of the trading chart indicates that the uptrend is all set to reverse. The confirmation on the change in trend is valid when a Doji is followed by a long Green Candlestick.
In this scenario, the doji represents uncertainty as there is indecision among the bulls to keep the trend ongoing. Which is why it has negative connotations in uptrends.
To keep this rally going, the buyers must be committed. If the market has seen a prolonged uptrend or is overbought, the appearance of a doji could indicate that the foundation of buyers support will eventually crumble or halt.
Doji Candlestick with High Trade Volumes
Whenever there is a formation of a Doji Candlestick Pattern on a trading period with high volumes, it is evident that there is a high pressure of buyers and sellers to drive the prices. During this period, the volatility of the stock rapidly rises.
A large trading volume suggests greater market activity and interest in the stock. Various variables, such as news releases, earnings reports, market events, economic statistics, or shifts in investor attitude, might cause an increase in trading volume.
It is advised to the retail traders to avoid trading once these patterns are observed. This event could be the most likely situation for your stop loss to get triggered due to the high volatility.
Doji Candlestick with Price Action
Price action is the examination and evaluation of a stock price movement on a chart. It is a fundamental approach to understanding market dynamics and making trading decisions based on the actual price movement itself.
For ease of understanding, let us consider “Support” and “Resistance”.
Support is a zone where the price has reversed its downtrend. These are the price levels where the buyers dominated. A formation of Doji will clearly indicate that the support level are strong and the price will reverse.
On the other hand, a formation of Doji at the resistance levels will clearly indicate that the price of the stock will not result in a break out and may decline.
Marubozu Candlestick Followed by Doji
Marubozu is a type of candlestick that depicts the change in trend. In looks, it is the complete opposite of Doji.
Doji has long wicks and no body, whereas a Marubozu has a long body and no wicks.
If a candlestick of the Marubozu type forms after a Doji, it may be safely considered that the trend will reverse and strongly continue in the direction of the Marubozu.
For example, consider a Green Marubozu is formed after a Doji candlestick pattern and a series of declining trend. This is a clear indication that the Price has hit in the favour of the buyers and the bulls will heavily go long at such price levels. Thereby, driving the prices higher.
Also Read: What Happens After Formation Of Marubozu Candlestick Pattern
Conclusion
Traders and investors can take advantage of potential chances and make better trading decisions by comprehending the Doji Patterns and analysing it within the larger market backdrop.
It offers a window into the ebb and flow of market psychology and is a useful tool for spotting periods of market hesitation and foreseeing probable trend reversals.
Traders and investors can take advantage of potential chances and make better trading decisions by combining fundamental analysis with the Doji.
Also read: The Best Doji Candlestick Trading Strategy For Beginners
